Pseudo SAS Code for Cox Model
Introduction
The following pseudo code assumes two arms, treatment vs control. When there are multiple treatment groups vs one control group, for each run of the code, only include one treatment vs the control.
The relevant SAP texts are as follows:
Cox regression with multiple baseline variables
Multivariable Cox regression analysis will be carried out to assess and adjust the treatment effect for relevant baseline factors of potential prognostic impact. A stepwise selection procedure will serve to identify explanatory variables of potential prognostic values additional to the randomization strata which will be included in all models during the selection procedure. The Cox's Proportional Hazard model is defined as:
\[ h(t) = h(0;t) e^{Xb} \]
where \(h(0;t)\) defines the baseline hazard function and \(X\) defines the vector of explanatory variables and b the unknown vector of regression parameters.
In the stepwise selection procedure, variables are entered into and removed from the model in such a way that each forward selection step can be followed by one or more backward elimination steps. The stepwise selection process terminates if no further variable can be added to the model or if the variable just entered into the model is the only variable removed in the subsequent backward elimination. The level of significance for an explanatory variable to enter the model is set to 0.15 (p-value of Score test) and the significance level for removing it is set to 0.40 (p-value of Wald test). This analysis will be performed using the stepwise selection method in SAS (Proc PHREG). Once this procedure stops, the factor treatment arm will be added to the last selected model in order to evaluate the effect of treatment on OS time when adjusted for the selected explanatory variables. The hazard ratios of all selected explanatory variables and of treatment effects will be reported including 2-sided 95% CIs. No interactions will be considered. Post-baseline factors will not be considered for the model.
Subset analyses
To assess the heterogeneity of treatment effects for PFS and OS across the subgroup levels, two Cox regression model will be fitted with PFS or OS, respectively, as the dependent variable and subgroup, treatment, and with and without the treatment-by-subgroup interaction as explanatory variables.
- Model 1: factors + treatment + subgroup
- Model 2: factors + treatment + subgroup + treatment \(\times\) subgroup-variable
A p-value for the interaction test (Likelihood Ratio test) will be provided together with the HR and corresponding 95% CI of the interaction model parameter.
Multivariable Cox regression
This is a 2 step process.
Step 1 – select the variables
1 | proc phreg data= ADTTE; |
Option selection specifies the method to conduct the model selection, adjust according to SAP.
Option slentry is p-value entry threshold for a variable, adjust according to SAP.
Option slstay is p value stay threshold (not to be removed from the model once in) for a variable, adjust according to SAP.
Option include is how many variables counting from the left after the equal sign to always keep in the model.
In this example stage is the stratification variable, and include=1 will always keep it in the model. If you have multiple stratification variables, then add them as the first x variables after the equal sign, and modify the value for include=x. Example:1
model TTE\*CENSOR (0)= strat1 strat2 strat3 OtherVar1 OtherVar2 OtherVar3/ include=3;
Option detail gives the model selection steps in the output.
Note treatment is not included in this step.
Step 2 – final model to report
After you got the final variable selections, run the following model (adding treatment here).1
2
3
4proc phreg data= ADTTE;
class TREATMENT (ref=value_for_control_arm) gender stage (ref='Stage 1');
model TTE * CENSOR (value_indicating_censored_observation) = TREATMENT SelectedVariable1 SelectedVariable2 / alpha=0.05 RL ties=discrete ;
run;
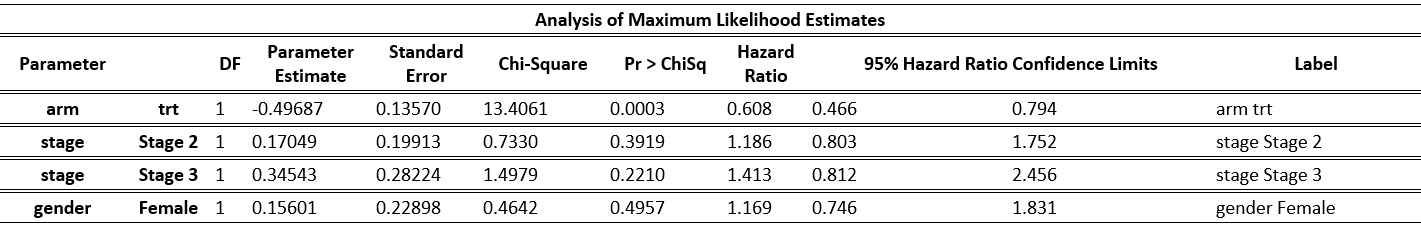
The following table shows the outputs.
Interaction test in Cox model
The p-value for the interaction test (Likelihood Ratio test) is requested via the type1 option in the model statement. Note the sequence of parameters must have the interaction term at the right most position (see the green text for sequence of parameters).
This code is run for each factor separately, e.g. run the model for age, run a separate model for gender and so on.1
2
3
4proc phreg data=ADTTE;
class TREATMENT (ref=value_for_control_arm);
model TTE * CENSOR (value_indicating_censored_observation) = TREATMENT VAR1 TREATMENT* VAR1 / alpha=0.05 RL ties=discrete type1;
run;
Pick the yellow highlighted p-value.
| Likelihood Ratio Statistics for Type 1 Analysis | ||||
|---|---|---|---|---|
| Source | -2 Log L | DF | LR Chi-Square | Pr > ChiSq |
| (Without Covariates) | 3430.3836 | . | . | . |
| arm | 3403.7614 | 1 | 26.6222 | <.0001 |
| age | 3403.6520 | 1 | 0.1094 | 0.7409 |
| age*arm | 3397.5799 | 1 | 6.0721 | 0.0137 |
HR for the interaction term = exponential (Parameter_Estimate).
Lower= Parameter_Estimate – 1.96* Standard Error
Upper= Parameter_Estimate + 1.96* Standard Error
Lower bound of 95% CI for HR = exponential (Lower)
Upper bound of 95% CI for HR = exponential (Upper)
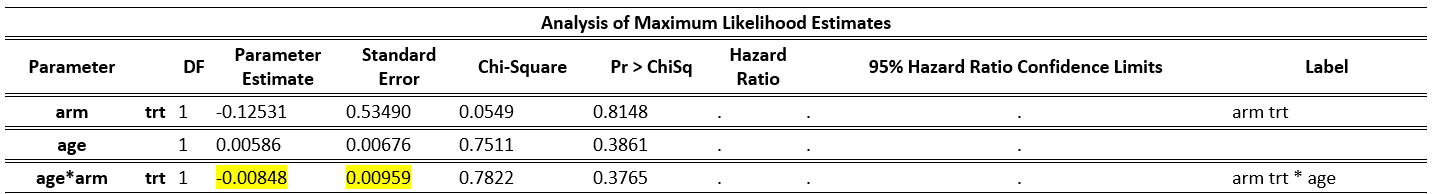
In the example below:
HR = exp(-0.00848) = 0.992
Lower = -0.00848 – 1.96*0.00959 = -0.02728
Upper= -0.00848 + 1.96*0.00959 = 0.010316
Lower bound of 95% CI for HR = 0.973
Upper bound of 95% CI for HR = 1.010
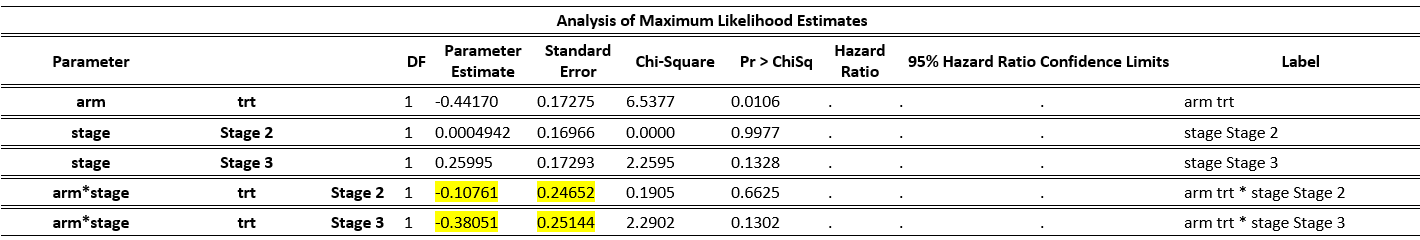
If the covariate is categorical and it has more than 2 levels (including the reference level), then there will still be only one p value for the interaction term. However, you will have multiple rows for the Parameter_Estimate and Standard_Error. Using the instructions above, get the HR and 95% CI for each. Example below shows a variable, stage, with 3 levels (level 1 is reference).
The p-value output:
| Likelihood Ratio Statistics for Type 1 Analysis | ||||
|---|---|---|---|---|
| Source | -2 Log L | DF | LR Chi-Square | Pr > ChiSq |
| (Without Covariates) | 3376.5810 | . | . | . |
| arm | 3344.8694 | 1 | 31.7116 | <.0001 |
| stage | 3343.8407 | 2 | 1.0287 | 0.5979 |
| arm*stage | 3341.4290 | 2 | 2.4116 | 0.2994 |
The HR and 95% CI: