Missing Data and MI in SAS (1)
Concepts in missing data and imputation
Two common missing data mechanisms in clinical trial
MAR
如果数据集中的其他变量(但不是该变量本身)可以用来预测某一特定变量的缺失,那么就可以说该变量是随机缺失(MAR)的。
例如,在调查中,女性可能比男性更有可能拒绝回答某些私密问题(也就是说,性别预测了另一个变量的缺失)。
如果数据是随机缺失的,并且缺失的概率不取决于缺失信息本身,那么就可以说缺失数据机制是可忽略的。无视性假设是对缺失信息进行优化估计的必要条件,也是我们将要讨论的两种缺失数据技术的必要假设。
MNAR
如果未观察到的变量的值本身预示着缺失,那么数据就被说成是非随机缺失。
这方面的一个典型例子是收入。 收入很高的人比收入中等的人更有可能拒绝回答关于他们收入的问题。
Missing data handling
了解我们的数据中存在的数据缺失机制很重要,因为不同类型的数据缺失需要不同的处理方法。当数据完全随机缺失(MCAR)时,只分析完整的案例不会导致有偏差的参数估计(例如,回归系数)。然而,分析的样本量会大大减少,导致标准误差增大。
相反,对于随机缺失(MAR)或非随机缺失(MNAR)的数据,只分析完整的案例会导致参数估计有偏差。
Multiple imputation 和其他现代方法,如direct maximum likelihood,一般假设数据至少是MAR,这意味着这一程序也可以用于完全随机缺失的数据。人们还开发了对MNAR过程进行建模的统计模型。
Multiple Imputation (MI)
对缺失数据插补方法的一个常见误解是假设估算值应该代表 "真实 "值。处理缺失数据的目的是正确重现我们在数据没有任何缺失信息的情况下观察到的方差/协方差矩阵。
多重插补(MI)本质上是随机插补的一种迭代形式。然而,不是填入一个单一的值,而是利用观察数据的分布来估计反映真实值周围不确定性的多个值。然后,这些值被用于感兴趣的分析中,
因此,在估算值中加入了围绕估算值的 "真实性 "的不确定程度。
多重插补都遵循相同的两个思路。
- 用保留观察数据所表达的关系的值来替换数据中的缺失值;
(2)使用独立抽取的插补值来创建几个数据集,并使用这些数据集之间的变化来扩大模型的标准误差,使其反映我们对参数归因模型的不确定性。
MI的经典三步骤:
Imputation or Fill-in Phase: The missing data are filled in with estimated values and a complete data set is created. This process of fill-in is repeated m times.
Analysis Phase: Each of the m complete data sets is then analyzed using a statistical method of interest (e.g. linear regression).
Pooling Phase: The parameter estimates (e.g. coefficients and standard errors) obtained from each analyzed data set are then combined for inference.
在开发插补模型时,评估我们的插补模型是否与我们的分析模型 "同源 "或一致是很重要的。
一致性意味着我们的插补模型包括(至少)我们的分析或估计模型中的相同变量。这包括为评估我们感兴趣的假设而需要对变量进行的任何转换。这可以包括对数转换、交互项或将连续变量重新编码为分类形式,如果这是在以后的分析中使用的方式。
这样做的原因可以追溯到前面关于多重插补的目的的说明。由于我们试图重现适当的方差/协方差矩阵来进行估计,所以我们分析变量之间的所有关系都应该同时被表示和估计。
否则,我们在归入值时就会假设它们与我们没有包括在归入模型中的变量的相关性为零。 这将导致低估我们的分析中感兴趣的参数之间的关联,并失去检测我们的数据可能感兴趣的属性的能力,如非线性和统计交互。
MI methods
根据缺失数据的模式和变量类型,PROC MI提供了三类主要的方法来生成多重插补。
如果缺失数据的模式是单变量(univariate)或单调(monotonic)的,那么monotone option是首选的方法。
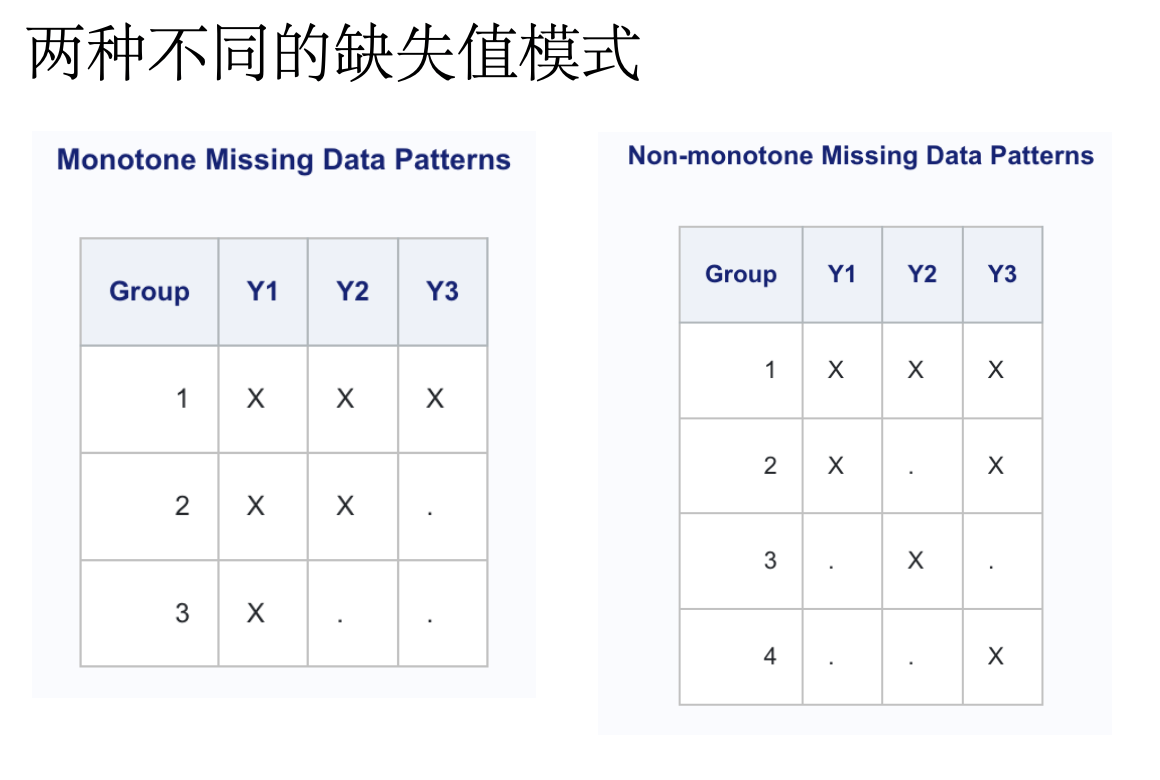
对于任意的多变量缺失数据模式,可以选择MCMC或FCS方法。下表根据缺失数据的模式和被归入的变量类型总结了SAS v9.4中可用的方法。
| Missing Data Pattern | Variable | Method | PROC MI Statement |
|---|---|---|---|
| Monotone | Continuous | Liner regression | MONOTONE REG |
| predictive mean matching | MONOTONE REGPMM | ||
| propensity score | MONOTONE PROPENSITY | ||
| Binary/Ordinal | Logistic regression | MONOTONE LOGISTIC | |
| Nominal | Discriminant function | MONOTONE DISCRIM | |
| Arbitrary | Continuous (with continuous covariates) | MCMC monotone methods | MCMC IMPUTE=MONOTONE |
| MCMC full data imputation | MCMC IMPUTE=FULL | ||
| Continuous (with mixed covariates) | FCS regression | FCS REG | |
| FCS predictive mean matching | FCS REGPMM | ||
| Binary/Ordinal | FCS logistic regression | FCS LOGISTIC | |
| Nominal | FCS discriminant function | FCS DISCRIM |
MCMC
一般情况下,缺失数据问题是涉及多变量的,具有任意的缺失值模式,并且可能包括不同类型的变量(continuous, nominal, binary, ordinal),在分析上很难,或者不可能评估联合后验分布(joint posterior distribution)的真实表达式(analytical true expression) \[ Posterior P(\theta \mid Y_\text{obs}) \] 在这种情况下,统计学家设计了迭代模拟技术(iterative simulation techniques),允许我们绕开解析解,以解决的复杂联合后验问题。 也就是用MCMC技术模拟出(draw)任意的复杂的后验分布。
Case 1 - multiple imputation for binary response
Primary analysis
Missing data due to intercurrent event A will be imputed employing MI using randomized treatment-based MCMC methodology.
The following SAS code will be used to generate the multiple imputation datasets:1
2
3
4
5
6
7/*Generate transpose of efficacy dataset- wide format before Step 1*/
PROC MI DATA=INDATA SEED=2023 NIMPUTE=35 OUT=OUT1 MINIMUM=0 MAXIMUM=4 ROUND=1;
/* Use numeric TRT */
BY TRT;
MCMC INITIAL=EM;
VAR BASE VISIT1 VISIT2 VISIT3 VISIT4;
RUN;
解析:
The
MCMCstatement specifies the details of the MCMC method for imputation.With
INITIAL=EM, PROC MI derives parameter estimates for a posterior mode, the highest observed-data posterior density, from the EM algorithm (即EM (posterior mode) estimates ). The MLE from the EM algorithm is used to start the EM algorithm for the posterior mode, and the resulting EM estimates are used to begin the MCMC method.The
VARstatement lists the variables to be analyzed. The variables can be either character or numeric. If you omit the VAR statement, all continuous variables not mentioned in other statements are used.
The following SAS code will then be used to calculate the difference of proportions for each imputed dataset and combine the analyses across imputations:1
2
3
4
5
6
7
8
9
10
11
12
13
14PROC SORT DATA=OUT1; BY _IMPUTATION_; RUN;
PROC FREQ DATA=OUT1;
BY _IMPUTATION_ ;
TABLES TRT*RESP / RISKDIFF CL;
ODS OUTPUT RISKDIFFCOL2=PROP;
RUN;
PROC MIANALYZE DATA=PROP;
WHERE ROW=’Difference’;
MODELEFFECTS RISK;
STDERR ASE;
ODS OUTPUT PARAMETERESTIMATES=PEST;
RUN;
Sensitivity analysis
The hypothetical strategy will be used for the intercurrent event B. All missing data will be imputed assuming missing not at random (imputing from the Placebo treatment arm, copy-reference). The following SAS code will be used to generate the multiple imputation datasets:1
2
3
4
5
6
7
8
9
10
11
12
13
14
15
16
17
18
19/*Generate transpose of efficacy dataset- wide format before Step 1*/
PROC MI DATA=INDATA SEED=2023 NIMPUTE=20 OUT=MDATA MINIMUM=0 MAXIMUM=4 ROUND=1;
/* Use numeric TRT */
BY TRT;
MCMC IMPUTE=MONOTONE;
VAR BASE VISIT1 VISIT2 VISIT3 VISIT4;
RUN;
PROC MI DATA=MDATA SEED=2023 NIMPUTE=1 OUT=OUT1 MINIMUM = . 0 0 0 0 0 MAXIMUM
= . 4 4 4 4 4 ROUND = . 1 1 1 1 1;
BY _IMPUTATION_;
CLASS TRT;
MONOTONE REG(VISIT1 = BASE/DETAILS);
MONOTONE REG(VISIT2 = BASE VISIT1/DETAILS);
MONOTONE REG(VISIT3 = BASE VISIT1 VISIT2/DETAILS);
MONOTONE REG(VISIT4 = BASE VISIT1 VISIT2 VISIT3/DETAILS);
MNAR MODEL(BASE VISIT1 VISIT2 VISIT3 VISIT4 / MODELOBS=(TRT=’0’));
VAR BASE VISIT1 VISIT2 VISIT3 VISIT4;
RUN;
解析:
The
MONOTONEstatement specifies imputation methods for data sets with monotone missingness. You must also specify aVARstatement, and the data set must have a monotone missing pattern with variables ordered in the VAR list.MONOTONE REGspecifies the regression method of continuous variables. The regression method is the default imputation method in the MONOTONE and FCS statements for continuous variables.[具体思路是,先由观测值以及它的协变量,建立回归模型,得到回归模型参数\(\vec{\hat{\beta}}\),以及与其相关的协方差矩阵\(\vec{\hat{V}}\)。再由这些参数模拟出posterior predictive distribution,并抽取出新的回归参数,再基于此去插补缺失值。具体如何模拟出posterior predictive distribution以及数学细节,参见Monotone and FCS Regression Methods ]The
MNARstatement imputes missing values by using the pattern-mixture model approach, assuming the missing data are missing not at random (MNAR).There are two main options in the MNAR statement,
MODELandADJUST. You use theMODELoption to specify a subset of observations from which imputation models are to be derived for specified variables. You use the ADJUST option to specify an imputed variable and adjustment parameters (such as shift and scale) for adjusting the imputed variable values for a specified subset of observations [使用 MODEL 选项来指定观测的一个子集,从中可以为指定的变量导出插补模型。使用 ADJUST 选项来指定估算变量和调整参数,以调整指定观测子集的估算变量值].The MNAR statement is applicable only if it is used along with a MONOTONE statement or an FCS statement.[PMM多重插补数学细节见 Multiple Imputation with Pattern-Mixture Models]
Case 2 - multiple imputation for continuous measure
The following case comes from Reference 4
Mock ADPRO ADaM dataset:

RESTRUCTURING ANALYSIS DATASET
1
2
3
4
5proc transpose data=adpro out=adpro_t prefix=y;
by usubjid trt01pn trt01p STRATA1 paramcd param;
id avisitn;
var aval;
run;

CHECKING THE MISSING DATA PATTERN
1
2
3
4
5proc mi data=adplda_t nimpute=0 simple;
class paramcd trt01pn;
fcs;
var y1-y5 paramcd trt01pn;
run;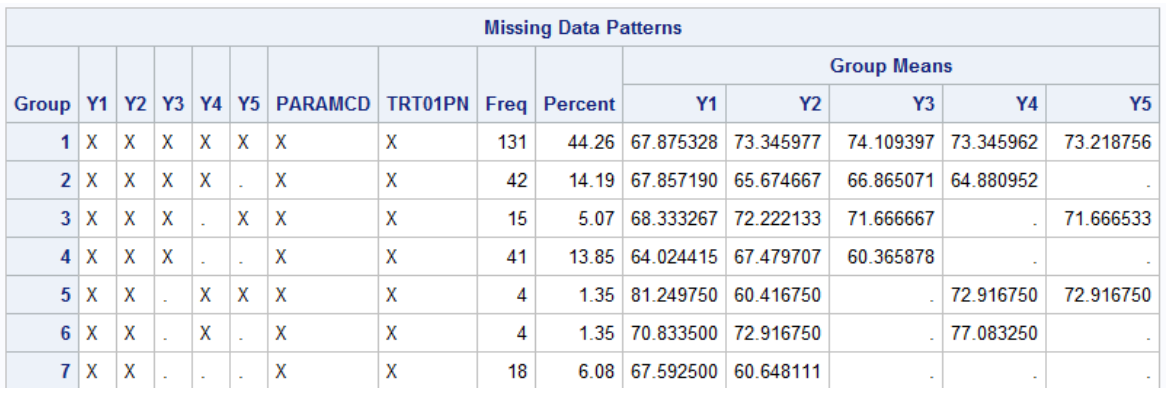
MODEL BASED MULTIPLE IMPUTATION (Step 1)
1
2
3
4
5
6
7proc mi data=adpro_t out=adpro_mi seed=3475 nimpute=50
minmaxiter=1000 minimum=. 0 0 0 0 0 maximum=. 100 100 100 100 100;
by paramcd trt01pn;
class STRATA1;
FCS REG (y1-y5);
var STRATA1 y1-y5;
run;
BACK TO ADAM BDS STRUCTURE
1
2
3
4proc transpose data=adpro_mi out=adpromi;
by _imputation_ trt01pn trt01p usubjid STRATA1 parcat2 paramcd
paramn param;
run;
ANALYSIS WITH MULTIPLE IMPUTED DATASET (Step 2)
1
2
3
4proc means data= adpromi MEAN STD median min max q1;
by _imputation_ trt01pn trt01p;
var aval base;
run;PROC MIXEDto analyze the data:1
2
3
4
5
6
7
8
9
10
11proc mixed data= adpromi;
by _imputation_;
class avisitn usubjid STRATA1N;
model aval=avisitn STRATA1N v2t1 v3t1 v4t1 v5t1 / ddfm=kr;
repeated avisitn / subject=usubjid type=un R;
estimate "P1: Week 24; TRT: 1" avisitn -1 0 0 0 1 v5t1 1 /
divisor=1 cl alpha=0.05;
estimate "P1: Week 24; TRT: 2" avisitn -1 0 0 0 1/
divisor=1 cl alpha=0.05;
estimate "P2: Week 24; TRT: 1 - 2" v5t1 1 / cl alpha=0.05;
run;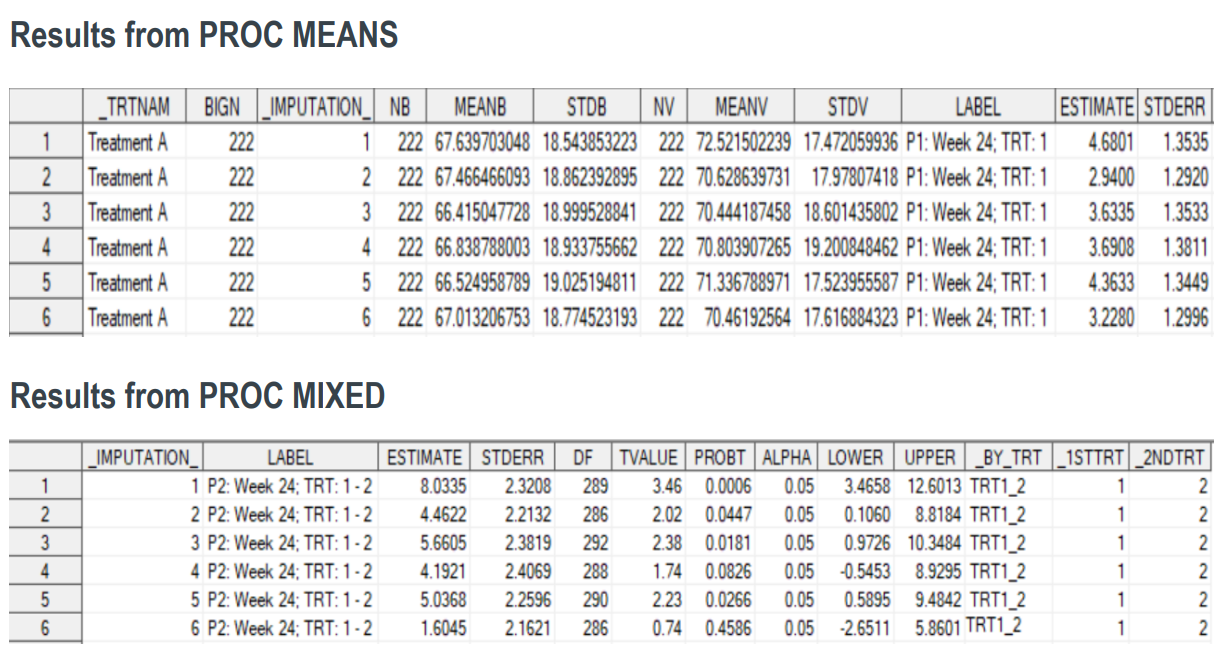
POOLING THE RESULTS (Step 3)
1
2
3
4
5
6proc mianalyze data=est_sum;
by _trtnam;
modeleffects estimate meanb meanv;
stderr stderr stdb stdv;
ods output ParameterEstimates=est0sum;
run;
1
2
3
4
5
proc mianalyze data=est_comp;
modeleffects estimate;
stderr stderr;
ods output ParameterEstimates=est0comp;
run;
REPORT
Report with multiple imputation
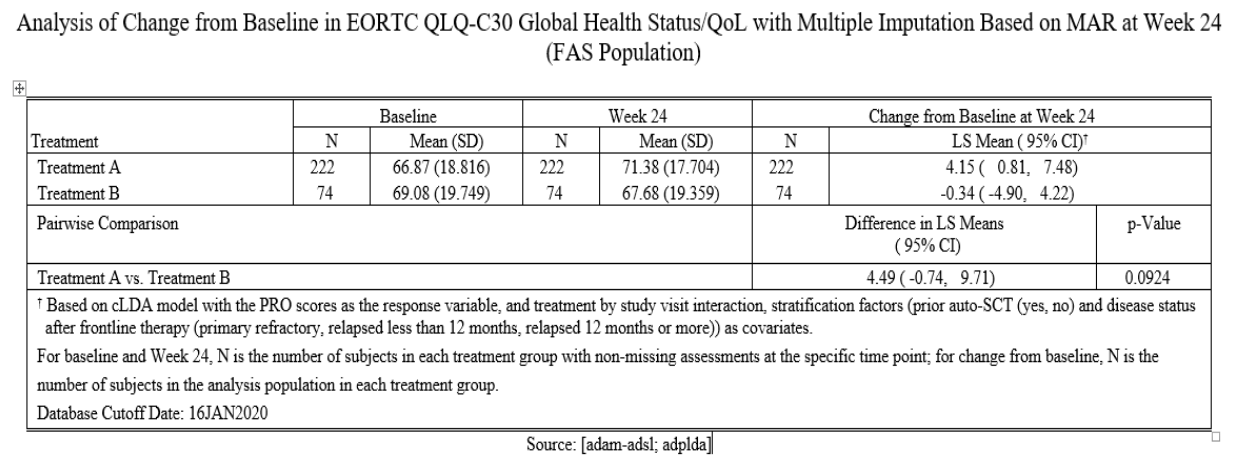
Comparison
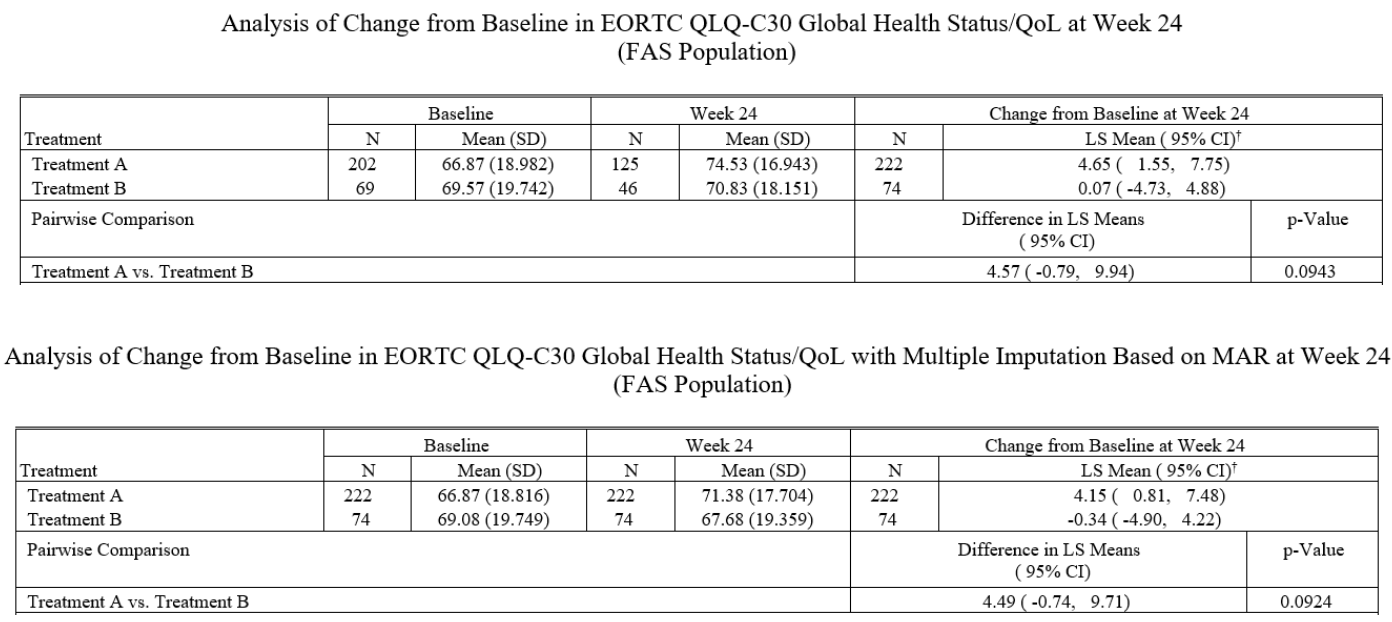
Report created with multiple imputation could be used as a supporting report as part of the sensitivity analysis, which can be requested by the submission agencies or the internal committees.
As per our case study results, we observe that the statistical inferences in report with MI are close to the statistical inferences from the main analysis Report (complete case analysis).
Reference
MCMC in Multiple Imputation (from Boehringer-Ingelheim) - LexJansen
Multiple Imputation: A Statistical Programming Story (CYTEL)
HANDLING MISSING DATA IN CLINICAL TRIALS (MERCK) - Lex Jansen
CDE审评员,《临床研究中缺失值的类型和处理方法研究》
link周晓华等,《缺失数据统计处理方法的研究进展》
link