A Discussion of Multiple Testing in Group Sequential Trial D4191C00004
Background
Study ID: D4191C00004 [ClinicalTrials.gov Identifier: NCT02352948; 一项评估 MEDI4736 (Durvalumab) 作为单一疗法或与 Tremelimumab 联合治疗的影响的全球研究,该研究通过 PD-L1 表达与护理标准对比确定,用于治疗局部晚期或转移性非小细胞肺癌 (ARCTIC) 患者]
Sub-study B has 1 treatment comparison of interest that is considered primary as follows:
- MEDI4736 20 mg/kg Q4W plus tremelimumab 1 mg/kg Q4W for 12 weeks then MEDI4736 10 mg/kg Q2W for 34 weeks compared with Standard of Care
The co-primary endpoints in each of the sub-studies are OS and PFS using RECIST v1.1.
The study was sized to assess PFS and OS endpoints in sub-study B for the treatment comparisons mentioned above.
No hypothesis testing will be performed on OS and PFS in Sub-study A; the analyses will be descriptive.
Protocol link:
D4191C00004 ProtocolSAP link:
D4191C00004 SAPAll above materials are published in CT.
Multiplicity (Sub-study B only)
Multiple testing schema
Figure 1 - Multiple testing procedures for controlling the type I error rate for substudy B (DCO: data cut-off)
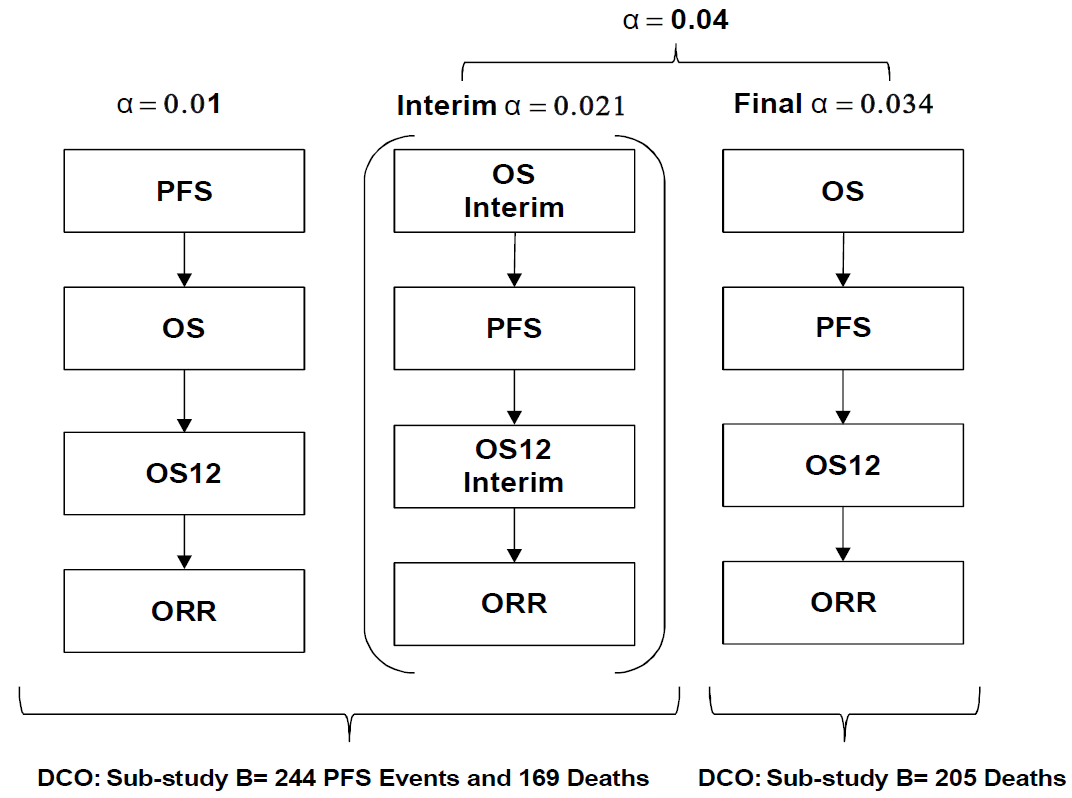
The Figure 1 above employs the multiple testing control approach proposed by Burman et al. (2009) and was presented in the default graph. It is not easy to convert it into a compact graph from my perspective.
The multiple testing procedure will define which significance levels should be applied to the interpretation of the raw p-values for the two primary endpoints of PFS and OS and the key secondary endpoints of OS12 (proportion of patients alive at 12 months from randomisation) and ORR.
Overall type I error control strategy
The overall type I error of 0.05 will be split between the co-primary endpoints OS and PFS.
To control for type I error, an alpha of 0.04 will be used for the analysis of OS and an alpha of 0.01 will be used for the analysis of PFS.
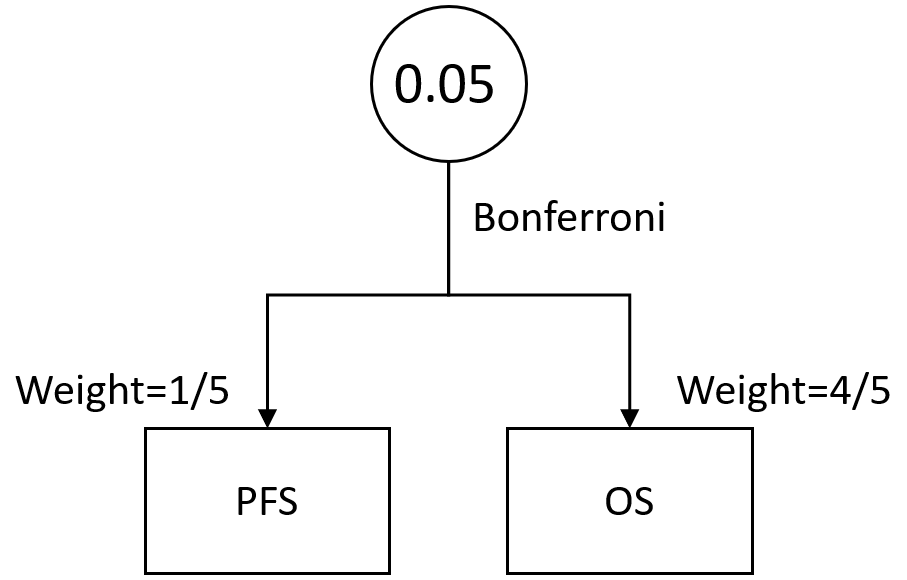
The study will be considered positive if the PFS analysis results and/or [comment: it is confusing that use word "and/or" to describe co-primary endpoint. Per FDA guidance on multiple endpoints, "multiple primary endpoints become co-primary endpoints when it is necessary to demonstrate an effect on each of the endpoints to conclude that a drug is effective."] the OS analysis results are statistically significant.
The 0.04 alpha level allocated to OS will be controlled at the interim and primary time point by using the Lan DeMets spending function that approximates an O’Brien Fleming approach, where the alpha level applied at the interim depends upon the proportion of information available.
Type I error control for OS
An interim OS analysis for superiority and the primary PFS analysis will occur at the same time and the primary OS analysis will be performed when it is expected 205 deaths have accumulated from patients who have been randomised to the MEDI4736+tremelimumab and Standard of Care arms.
For example, if 82% (\(169/205\) deaths have occured) of the deaths required at the time of the primary OS analysis are available at the time of the interim, the two-sided alpha level to be applied in the OS interim analysis would be 0.021 and the two-sided alpha level to be applied for the primary OS analysis would be 0.034.
Analysis timepoint
At the time of the primary PFS, interim OS and primary OS analyses, the primary and key secondary hypotheses will be tested on the primary treatment comparisons only, using a multiple testing procedure with an alpha-exhaustive recycling strategy (Burman et al 2009).
With this approach, hypotheses will be tested in a pre-defined order. At the time of the primary PFS analysis, the PFS endpoint will be tested first and at the time of the primary OS analysis, the OS endpoint will be tested first.
The other hypotheses corresponding to secondary endpoints will then be tested in a pre-specified hierarchy following PFS and OS rejection. This testing procedure stops when the entire test mass is allocated to non-rejected hypotheses. Implementation of this pre-defined ordered testing procedure, including recycling, will strongly control type I error at 0.05 (two-sided), amongst all key hypotheses.

Upon achieving statistical significance on the PFS endpoint in sub-study B, the testing of the OS endpoint will be performed hierarchically as illustrated in Figure 1.
Similarly the testing of the PFS endpoint will be done subsequent to achieving statistical significance on the interim/primary OS endpoint in sub-study B. [comment: it is confusing that use "/" to describe the procedure. In my understanding, there are two possible scenarios to perform the hypotheses tests which is described in below figure.]
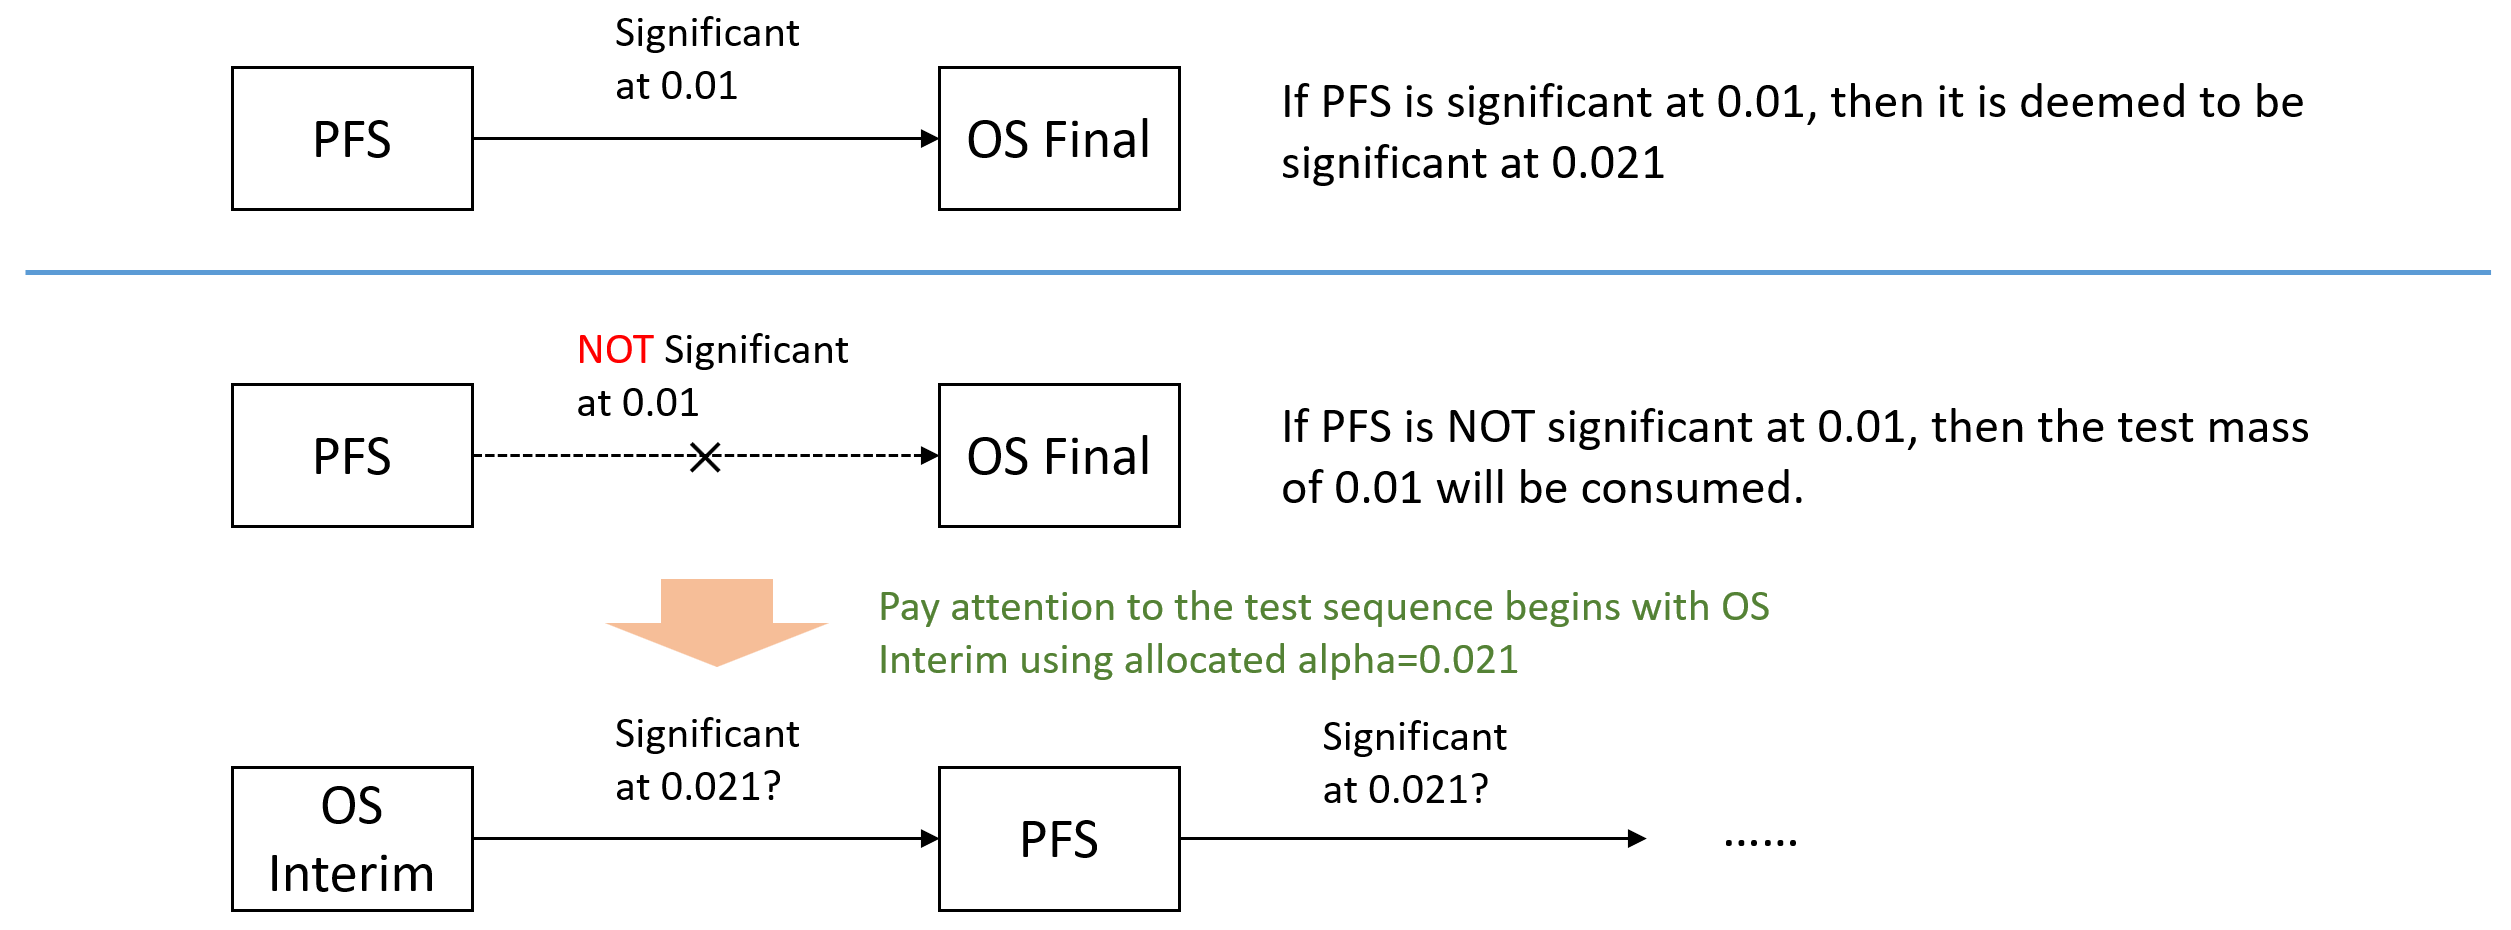
[comment: I cannot understand if OS Interim is significant at 0.021 but PFS fails to be significant at 0.021, will there be another test of PFS after testing OS Final according to Figure 1? In their SAP, it didn't tell us how to handle this situations. Because at the timepoint of OS Final testing, the PFS events won't be the same as that in the time of testing OS Interim. Basically it is actually PFS Interim and PFS Final. Lacking any fuller explanation from the SAP, my question remains.]
If both of these endpoints are significant, the alpha level can be combined and passed down to lower levels in the hierarchy. Spending alpha between endpoints in this way will strongly control type I error (Glimm et al 2010).
It is currently anticipated that the cut-off for PFS co-primary analysis will be before the cut-off for OS co-primary analysis on sub-study B. Alpha will be recycled across the PFS and OS hierarchies at the time of the final analysis of the respective endpoints.[comment: 只在最终分析的时候进行alpha传递?那么PFS分析时候事件数是多少?SAP未提。]
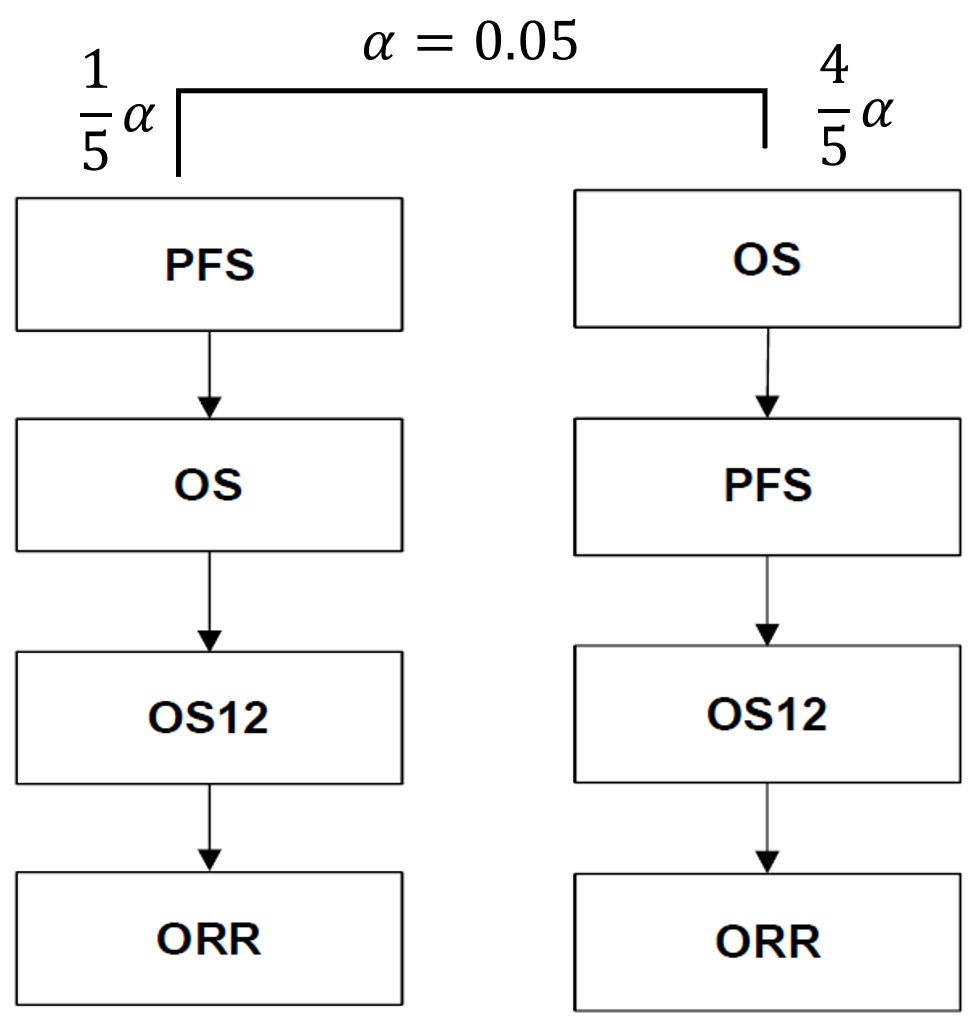
If the PFS and OS analyses are closely aligned and performed at the same time, the same alpha split (0.01 vs. 0.04) will be applied to the PFS analysis and OS analysis, and the alpha will be recycled between PFS and OS if either of them is significant.[comment: 如果PFS分析和OS分析很接近,那么就不会发生OS Interim。整个alpha传递过程简化为下图的Burman default graph]
Further reading on GSD with multiple endpoints problems
Consider test \(h>1\) one-sided hypotheses \(H_i,i\in I=\left \{1,...,h \right \}\) in a group sequential trial at \(k\) time points \(t = 1,...,k\).
The FWER will be controlled in the strong sense in \(\alpha\).
There are 2 general approaches (Willi Maurer & Frank Bretz (2013)):
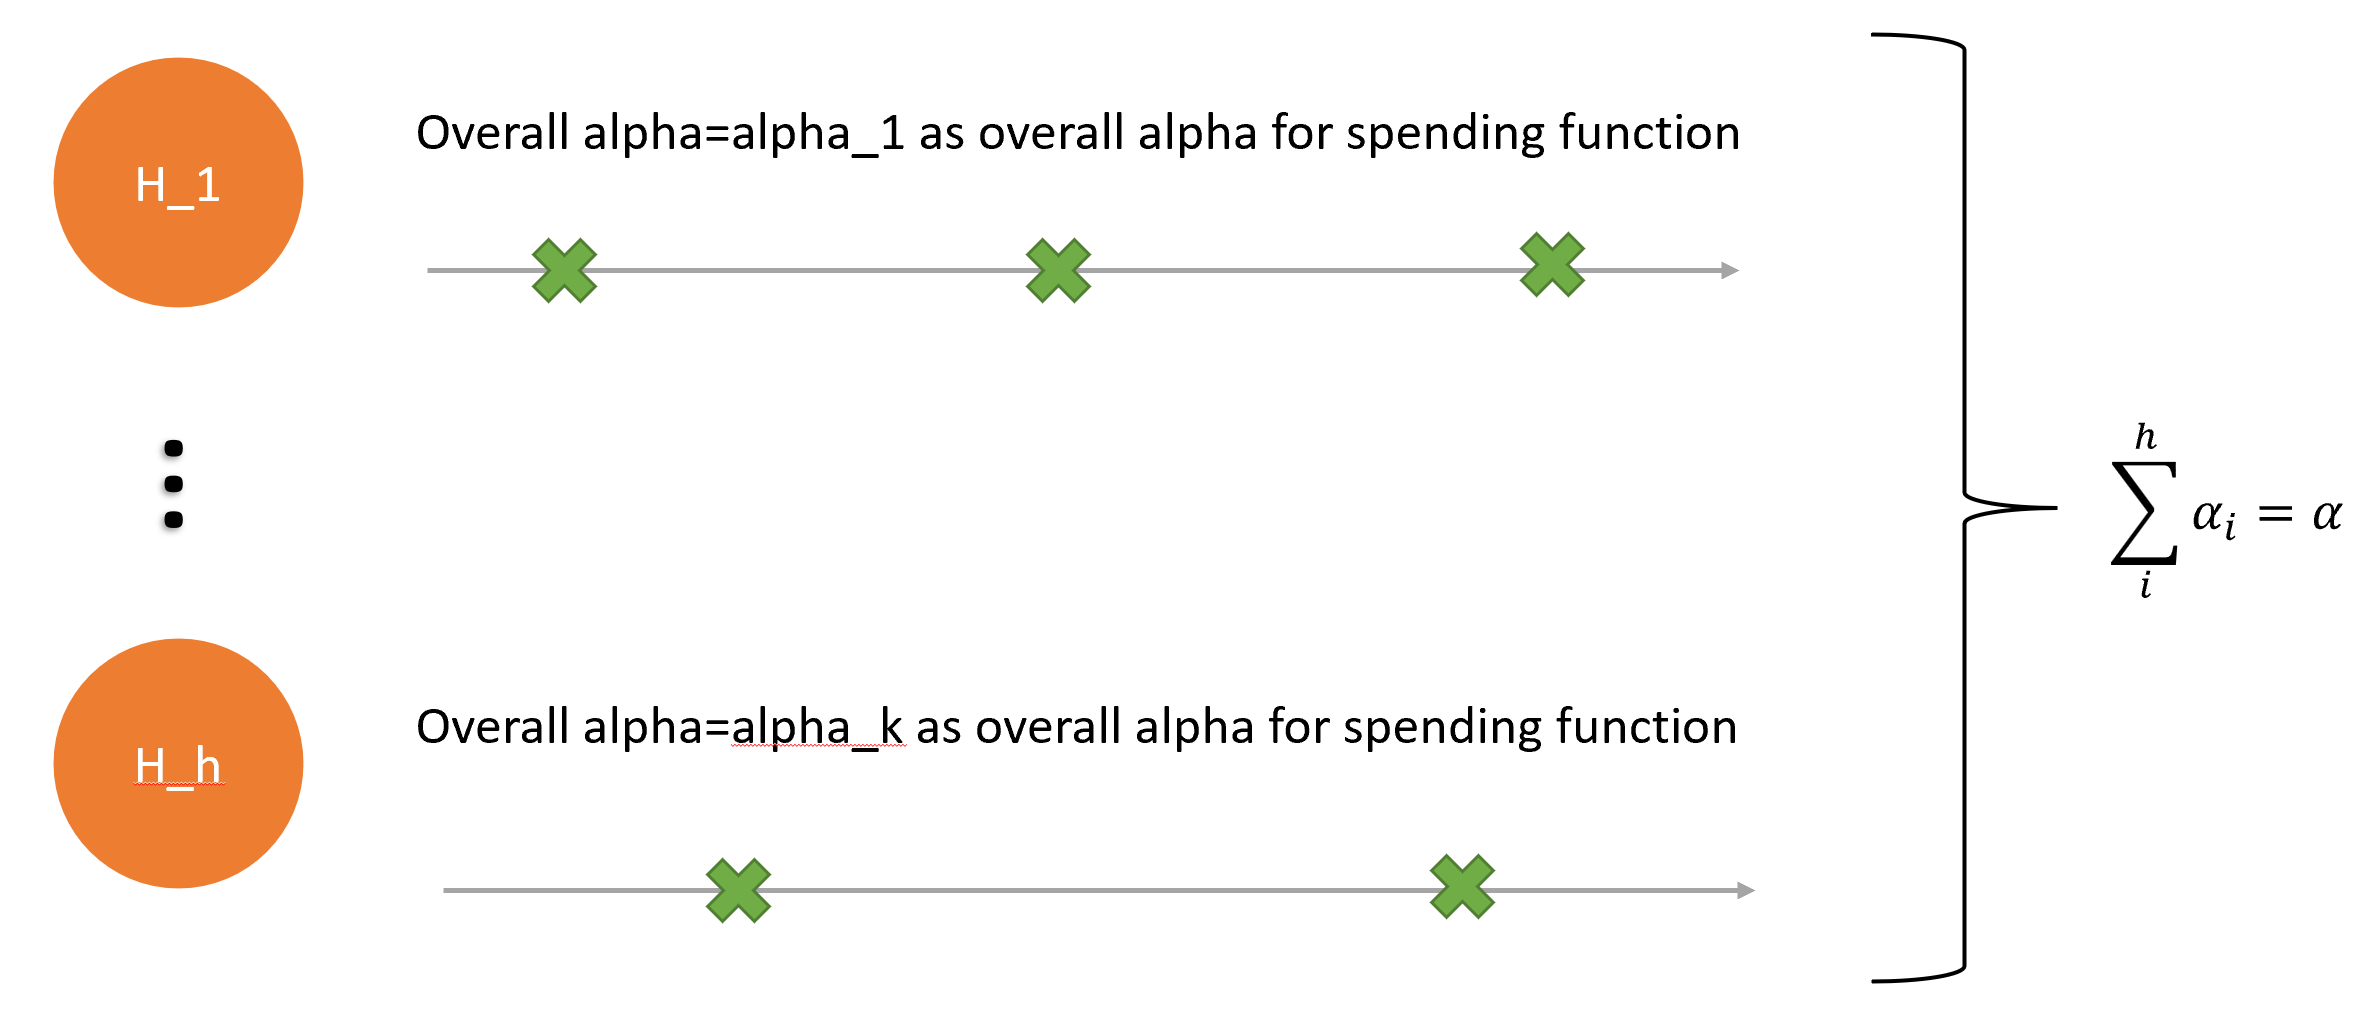
1) The Bonferroni inequality to the \(h\) hypotheses
Assign each hypothesis \(H_i,i\in I\) a local significance level \(\alpha_i\) such that \(\sum_{i}^h \alpha_i=\alpha\).
Define univariate testing strategies with appropriate spending functions \(\alpha_i(y), 0 \le y \le 1\), separately for each of the \(\alpha_i\)’s.
Since the probability of erroneously rejecting a hypothesis \(H_i\) at an interim or the final analysis is bounded by \(\alpha_i\) , the probability to erroneously reject any hypothesis under the global null \(H_I = \bigcap_{i}^{h}H_i\) or any intersection hypothesis \(H_J = \bigcap_{i \in J} H_i, J \subset I\) is bounded by \(\alpha\).
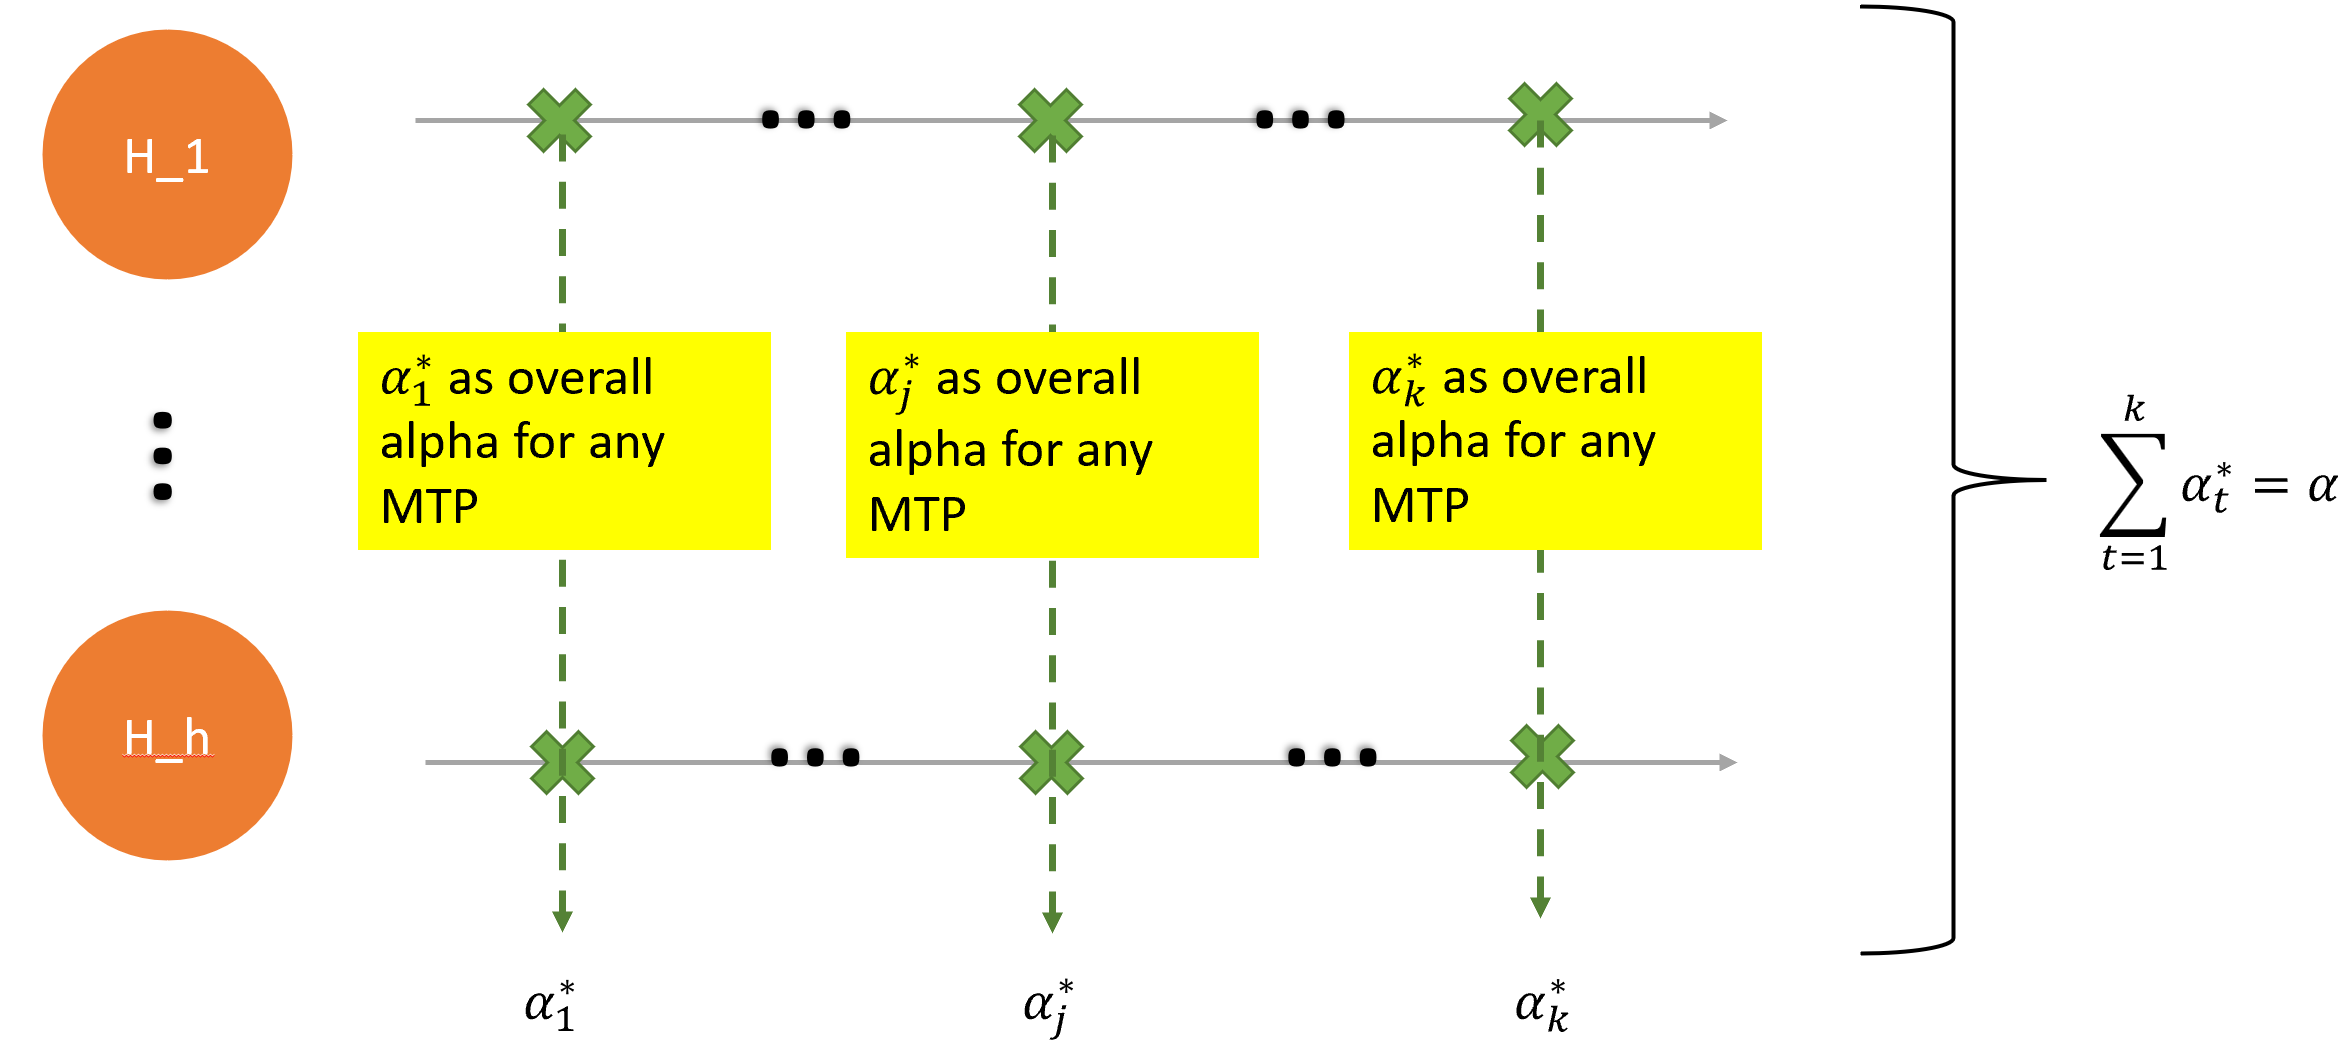
2) The Bonferroni inequality to repeated testing
A set of nominal rejection boundaries \(\alpha_t^{\ast},t = 1,...,k\), is fixed such that \(\sum_{t=1}^k \alpha_t^{\ast}=\alpha\).
At each time point \(t\), a multiple testing procedure is applied to the \(h\) hypotheses that protects the FWER at level \(\alpha_t^{\ast}\).
Note that at each interim analysis a multiple testing procedure can be used that exploits known correlations between the test statistics, such as a stepwise Dunnett test for comparing several treatments with a control.
However, due to the positive correlation of the sequential test statistics for a given hypothesis, the actual significance levels spent, \(\alpha_t,t = 2,...,k\), are smaller than the chosen nominal levels and hence the actual overall level is less than \(\alpha\). [comment: 即,这个方法会带来power loss,如果中期分析的nominal significance level非常低,那这个power loss还是可以接受的,比如使用OBF-type spending function;但是其他形式的spending function带来的power loss是非常大的,导致这个方法不可接受]
Reference
Burman, C.-.-F., Sonesson, C. and Guilbaud, O. (2009), A recycling framework for the construction of Bonferroni-based multiple tests. Statist. Med., 28: 739-761. https://doi.org/10.1002/sim.3513
Willi Maurer & Frank Bretz (2013) Multiple Testing in Group Sequential Trials Using Graphical Approaches, Statistics in Biopharmaceutical Research, 5:4, 311-320, DOI: 10.1080/19466315.2013.807748