Measures of Missing Data Information From PROC MIANALYZE
Introduction
These measures are the Fraction of Missing information (FMI), the relative increase in variance due to nonresponse (RIV), and the Relative Efficiency (RE). They are derived from values of the between, and within imputation variance and the total variance. There exist two versions of the FMI, which are referred to as lambda and FMI.
We usually report these measures of Missing data information in TLGs of sensitivity analyses.
How does PROC MIANALYZE work
- PROC MIANALYZE combines results across imputations.
- Regression coefficients are averaged across imputations.
- Standard errors incorporate uncertainty from 2 sources:
- "within imputation" - variability in estimate expected with no missing data: The usual uncertainty regarding a regression coefficient;
- "between imputation" - variability due to missing information: The uncertainty surrounding missing values.

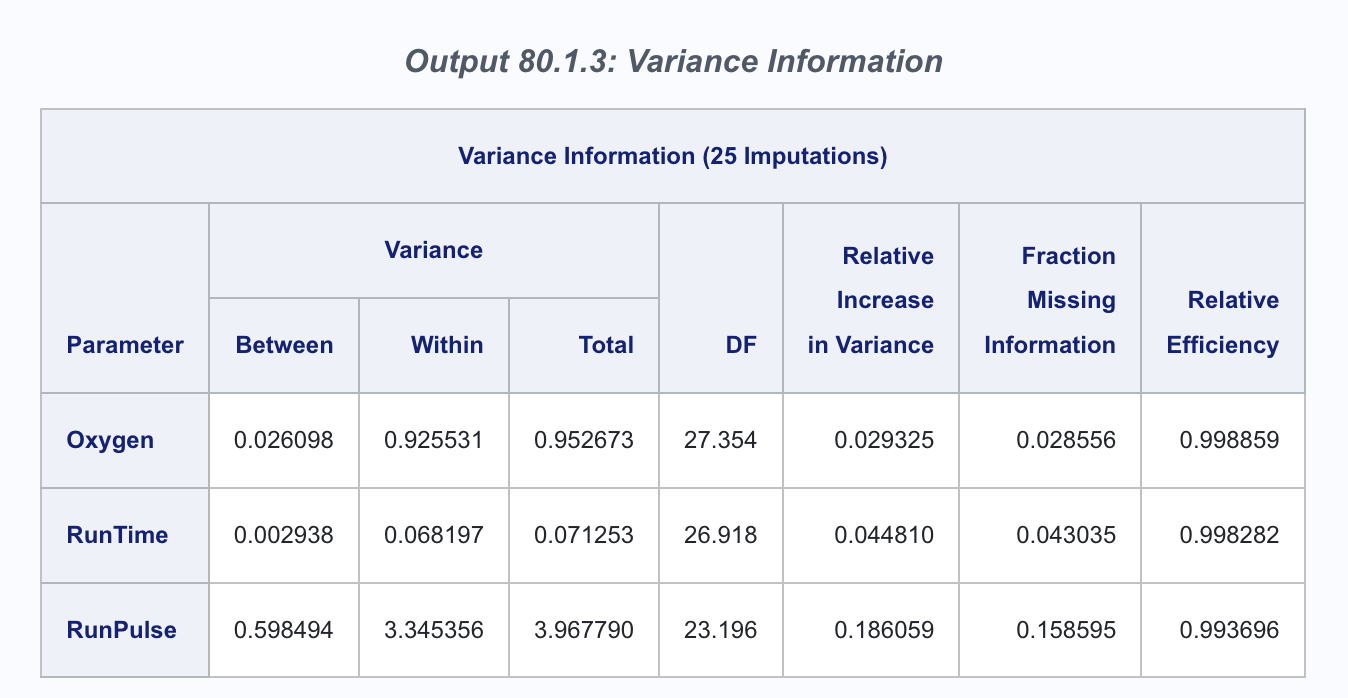
Source: https://documentation.sas.com/doc/en/pgmsascdc/9.4_3.4/statug/statug_mianalyze_examples01.htm
Variance
Variance Within
Sampling variability is expected with no missing data.
Average of the variability of coefficients within an imputation.
Equal to the arithmetic mean of sampling variances (\(SE^2\)).
Example
Add together 25 estimated \(SE^2\) for Oxygen in the above screenshot and divided by 25, we got \(V_W=0.925531\).
Variance Between
- Variability in estimates across imputations, i.e. the variance of the \(m\) (the number of imputations) coefficients.
- Estimates the additional variation (uncertainty) that results from missing data.
Example
Take all 25 of the parameter estimates (\(\beta\)) for Oxygen and calculating the variance, we got \(V_B=0.026098\).
Variance Total
The total variance is the sum of 3 sources of variance:
Within,
Between,
The additional source of sampling variance.
What is the sampling variance?
Variance Between divided by number of imputations.
Represents sampling error associated with the overall coefficient estimates.
Serves as a correction factor for using a specific number of imputations.
Degree of Freedom
DF for combined results are determined by the number of imputations.
By default DF = infinity, typically not a problem with large \(N\) but can be with smaller samples.
The standard formula to estimate DF can yield estimates that are fractional or that far exceed the DF for complete data.
Correction to adjust for the problem of inflated DF has been implemented.
Use the
EDFoption on the PROC MIANALYZE line to indicate to SAS what is the proper adjusted DF.
Fraction of Missing Information - \(\lambda\)
The proportion of total variance due to missingness, \(\lambda\), (Van Buuren (2018); Raghunathan (2016)) can be derived from the between and total missing data variance as: \[ \lambda = \frac{V_B + \frac{V_B}{m}}{V_T} \] Where \(m\) is the number of imputed datasets and \(V_B\) and \(V_T\) are the between and total variance respectively. This value can be interpreted as the proportion of variation in the parameter of interest due to the missing data.
For a given variable, FMI is based on percentage missing and correlations with other imputation model variables. Interpretation similar to an \(R^2\).
Example: FMI=.046 for write means that 4.6% of sampling variance is attributable to missing data.
More details in SAS: Link
Relative Increase in Variance - RIV
Another related measure is the relative increase in variance due to nonresponse. This value is calculated as: \[ RIV = \frac{V_B + \frac{V_B}{m}}{V_W} \] Where \(V_B\) and \(V_W\) are the between and within variance respectively. This value can be interpreted as the proportional increase in the sampling variance of the parameter of interest that is due to the missing data.
More details in SAS: Link
The relation between RIV and \(\lambda\) is defined as: \[ RIV = \frac{\lambda }{1 - \lambda} \]
Fraction of Missing Information - FMI
It is not \(\lambda\) we just saw in the previous section !!
The Fraction of Missing Information is defined as: \[ FMI = \frac{RIV + \frac{2}{df+3}}{1+RIV} \] Where RIV is the relative increase in variance due to missing data and df is the degrees of freedom for the pooled result. The degrees of freedom for the pooled result can be obtained in two ways: \({df_{Old}}\) or \({df_{Adjusted}}\).
The difference between \(\lambda\) and FMI is that FMI is adjusted for the fact that the number of imputed datasets that are generated is not unlimitedly large. These measures differ for a small value of the df.
More details in SAS: Link
Relative Efficiency
The Relative Efficiency (RE) is defined as: \[ RE = \frac{1}{1+\frac{FMI}{m}} \] FMI is the fraction of missing information and \(m\) is the number of imputed datasets.
The RE gives information about the precision of the parameter estimate as the standard error of a regression coefficient.
More details in SAS: https://documentation.sas.com/doc/en/pgmsascdc/9.4_3.4/statug/statug_mianalyze_details09.htm